Site
Search and Site Map
Site
Search and Site Map
Table of Contents


What Is Geography?
The science of geography is likely the oldest of all sciences. Geography is the answer to the question that the earliest humans asked, "What's over there?" Exploration and the discovery of new places, new culture, and new ideas have always been basic components of geography.
Geography is often called the "mother of all sciences" as studying other people and other places led to other scientific fields such as biology, anthropology, geology, mathematics, astronomy, chemistry and etc.
Geography looks at how things differ from place to place.
Geography has no unique body of facts or concepts it can call wholly its own. It is a very broad field of inquiry and borrows its concepts from related disciplines.
Geography is both a physical science and a social science and combines characteristics of both.
Geography is interested in interrelationships … in examining how various factors interrelate.
The Geographic Continuum
What Is Physical Geography?
Earth is a closed system / sphere that we divide into 4 sub-spheres.
1. atmosphere
composition
climate vs. weather
energy, heat
and temperature
pressure
and wind
moisture
storms
and disturbances
climatic zones
2. hydrosphere
water properties
water distribution
water cycle – oceans, evaporation, sublimation, evapotranspiration, atmosphere, condensation, precipitation, ice
and snow, snowmelt, runoff, stream flow, surface water, infiltration, ground water, discharge, springs
3. biosphere
ecosystems
actors that influence ecosystems
biogeochemical cycles
4. lithosphere
soil
earth’s structure
plate tectonics
landforms
geological hazards
Form vs. Process

Cartography
The Geographic Grid
A. A system of accurate location is necessary to pinpoint with mathematical precision the position of any spot on Earth’s surface.
1. The grid system is the simplest technique, using a network of intersecting lines.
2. Graticule — the grid system for mapping Earth that uses a network of parallels and meridians (lines of latitude and longitude).
Four Earth features provide the set of reference points essential to establish the graticule as an accurate locational system: North Pole, South Pole, rotation axis, and equatorial plane (an imaginary plane passing through Earth halfway between the poles and perpendicular to rotation axis).
3. Equator — the imaginary midline of Earth, where the plane of the equator intersects Earth’s surface. Is the parallel of 0° latitude.
4. Great Circle — the largest circle that can be drawn on a sphere; it must pass through the center of the sphere; it represents the circumference and divides surface into two equal halves or hemispheres.
Circle of Illumination—a great circle that divides Earth between a light half and a dark half.
5. Small circle — a plane that cuts through a sphere without passing through the center.
6. Graticule — grid system of the Earth consisting of lines of latitude and longitude.
B. Latitude
1. Latitude — the distance measured north and south of the equator; it is an angular measurement, so is expressed in degrees, minutes, and seconds.
2. Parallel — an imaginary line that connects all points of the same latitude; because they are imaginary, they are unlimited in number.
3. Seven parallels are particularly significant.
a) Equator, 0°
b) North Pole, 90° N
c) South Pole, 90° S
d) Tropic of Cancer, 23.5° N
e) Tropic of Capricorn, 23.5° S
f) Arctic Circle, 66.5° N
g) Antarctic Circle, 66.5° S
4. Regions on Earth are sometimes described as falling within general bands of latitude.
a)
Low latitude — generally between the equator and 30º N and S
b) Midlatitude — between about 30º N and S
c) High latitude — latitudes greater than about 60º N and S
d) Equatorial — within a few degrees of the equator
e) Tropical — within the tropics (between 23.5º N and 23.5º S)
f) Subtropical — slightly poleward of tropics, generally around 25–30º N and S
g) Polar — within a few degrees of the North or South Pole
5. Nautical Miles
a) The actual length of one degree of latitude varies according to where it is being measured on Earth, because of the polar flattening of Earth. Even with the variation, each degree has a north–south length of about 111 kilometers (69 miles).
b) A nautical mile is defined by the distance covered by one minute of latitude (1.15 statute miles or 1.85 kilometers).
C. Longitude
1. Longitude — the distance measured east and west on Earth’s surface.
2. Meridian — imaginary line of longitude extending from pole to pole (aligned in a north–south direction), crossing all parallels at right angles. (It’s not to be confused with its other definition, the sun’s highest point of the day.)
Meridians are not parallel to each other, except where they cross at the equator, where they are also the furthest apart. They close together northward and southward, converging at the poles.
3. Prime
Meridian — the meridian passing through the Royal Observatory at Greenwich, England. Longitude is measured from this meridian both east and west to a maximum of 180°.
Map Resources:
World
Atlas.com
World Atlas by
Holt, Rinehart and Winston
CIA World Reference Maps
National Geographic Map Machine
University Of Texas
Maps
Map Interpretation and Analysis
Latitude and Longitude (3:14)
How Maps Work
USGS Maps
Page
Map Scale
A. Map Scale — gives the relationship between length measured on the map and corresponding distance on the ground. Essential for being able to measure distance, determine area, and compare sizes.
B. Scale can never be perfectly accurate, again because of the curve of Earth’s surface. The smaller the area being mapped, the more accurate the scale can be.
C.
Scale Types
1. Several ways to portray scale, but only three are widely used.
a) Graphic Map Scales -- Uses a line marked off in graduated distances; remains correct when map is reproduced in another size, because both the graphic scale line and the map size change in same dimension.
b) Fractional Map Scales
(1) Uses a ratio or fraction, called a representative fraction, to express the comparison of map distance with ground distance on Earth’s surface.
(2) 1/63,360 is commonly used because the number in denominator equals the number of inches in one mile.
(3) Often, no units are given in a fractional scale, so the dimensions translate whether one is using inches, millimeters, or some other unit of measurement.
c) Verbal Map Scales -- Also called word scale; uses words to give the ratio of the map scale length to the distance on Earth’s surface.
D. Large and Small Scale
1. The concepts of “large” and “small” are comparative, not absolute; it all depends on the frame of reference whether one considers something large or small.
2. Large-scale map — has a relatively large representative fraction, which means the denominator is “small” — 1/10,000 is large-scale as compared to 1/1,000,000. Portrays only a small portion of Earth’s surface, providing considerable detail.
3. Small-scale map — has a small representation fraction, which means the denominator is “large.” Portrays a larger portion of Earth’s surface, but gives only limited detail.
Map Projections
A. Map projection — the system used to transform the rounded surface of Earth to a flat display.
B. The fundamental problem with mapping is how to minimize distortion while transferring data from a spherical surface to a flat piece of paper.
C. The Major Dilemma: Equivalence versus Conformality
1. Central problem in constructing and choosing a map projection
a) Impossible to perfectly portray both size and shape, so must strike a compromise between equivalence and conformality.
(1) Equivalence — the property of a map projection that maintains equal areal relationships in all parts of the map.
(2) Conformality — the property of a map projection that maintains proper angular relationships of surface features.
Can only closely approximate both equivalence and conformality in maps of very small areas (e.g., large-scale maps).
Mapmaking must be an art of compromise. Robinson projection is one of the most popular methods for compromising between equivalence and conformality.
2. Equivalent projection — portrays equal areal relationships throughout, avoiding misleading impressions of size.
Disadvantages
(1) Difficult to achieve on small-scale maps, because they must display disfigured shapes. Greenland and Alaska usually appear squattier than they actually are on equivalent projections.
(2) Even so, most equivalent world maps are small-scale maps.
3. Conformal projection — maintains proper angular relationships in maps so the shape stays accurate (e.g., Mercator projection).
Disadvantages
(1) Impossible to depict true shapes for large areas like continents.
(2) Biggest problem is that they must distort size (e.g., usually greatly enlarges sizes in the higher latitudes.
Types of Maps
Remote Sensing
A. Remote sensing — study of an object or surface from a distance by using various instruments.
1. Sophisticated technology now provides remarkable set of tools to study Earth, through precision recording instruments operating from high-altitude vantage points.
2. Different kinds of remote sensing: Aerial photographs, color and color infrared sensing, thermal infrared sensing, microwave sensing, radar, sonar, multispectral, and SPOT imagery.
B. Aerial Photographs
1. First form of remote sensing
2. Aerial photograph — photograph taken from an elevated “platform” such as a balloon, airplane, rocket, or satellite
a) Either oblique or vertical
(1) Oblique — camera angle is less than 90°, showing features from a relatively familiar point of view.
(2) Vertical — camera angle is approximately perpendicular to Earth surface (allows for easier measurement than oblique photographs).
b) Photogrammetry — science of obtaining reliable measurements from photographs and, by extension, the science of mapping from aerial photographs.
C.
Orthophoto Maps
Orthophoto maps — multi-colored, distortion-free photographic maps produced from computerized rectification of aerial imagery.
1. Show the landscape in much greater detail than a conventional map, but are like a map in that they provide a common scale that allows precise measurement of distances.
2. Particularly useful in flat-lying coastal areas because they can show subtle topographic detail.
D. Color and Color Infrared Sensing
1. Color — refers to the visible-light region of the electromagnetic spectrum.
2. Color infrared (color IR) — refers to the infrared region of the spectrum.
a) Color IR film is more versatile; uses include evaluating health of crops and trees.
b) Color IR film cannot detect much of the usable portion of the near infrared. Scanner systems have come to aid, by being able to sense much further into infrared.
c)
Landsat — a series of satellites that orbit Earth and can digitally image all parts of the planet except the polar regions every nine days.
E. Thermal Infrared Sensing
1. Thermal Infrared Sensing (thermal IR) — middle or far infrared part of electromagnetic spectrum; can’t be sensed with film.
2. Thermal scanning is used for showing diurnal temperature differences between land and water and between bedrock and alluvium, for studying thermal water pollution, for detecting forest fires, and, its greatest use, for weather forecasting.
F. Microwave Sensing
Microwave radiometry — senses radiation in the 100-micrometer to 1-meter range. Useful for showing subsurface characteristics such as moisture.
G. Multispectral Remote Sensing
1. These systems image more than one region of the electromagnetic spectrum simultaneously from the same location.
2. Landsat
a) The early Landsat was the multispectral scanning system (MSS) — a system that images Earth’s surface in several spectrum regions.
b) Landsat Sensory Systems use an MSS; can gather more than 30 million pieces of data for one image 183-by-170 kilometers (115-by-106 miles).
3. Thematic mapper — uses seven bands to improve resolution and greater imaging flexibility. Images in eight spectral bands with a resolution of 15 meters became available with the launching of Landsat 7 in 1977.
4. In 1999, Landsat 7 was launched, carrying an enhanced thematic mapper plus (ETM+) It uses eight spectral bandwidths with a resolution of 15 meters in the panchronic band, 30 meters in the visible and infrared network, and 60 meters in the thermal infrared.
H. Earth Observing System Satellites
1. NASA’s Earth Observing System (EOS) satellite Terra was launched in 1999.
2. The satellite contains a moderate resolution imagery spectroradiometer (MODIS) that gathers 36 spectral bands.
3. The latest device is a multiangle image spectroradiometer (MIS) that is capable of distinguishing various types of atmospheric particulates, land surfaces and cloud forms.
4. The most recent EOS satellite Aqua monitors water vapor, precipitation, clouds, glaciers, and soil wetness. Aqua also includes the atmospheric Infrared Sounder (AIRS), which permits accurate atmospheric temperature measurements.
I. Radar and Sonar Sensing
1. Radar — (radio detection and ranging) senses wavelengths longer than 1 millimeter and now provides images in photo-like form.
Radar is unique in its ability to penetrate atmospheric moisture, so it can analyze wet tropical areas that can’t be sensed by other systems. Radar is particularly useful for terrain analysis.
2. Sonar — (sound navigation ranging) permits underwater imaging.
Global Positioning System
Global Positioning System (GPS) — a satellite-based system for determining accurate positions on or near Earth’s surface. High-altitude satellites (24) continuously transmit both identification and position information that can be picked up by receivers on Earth. Clocks stored in both units help in calculating the distance between the receiver and each member of a group of four (or more) satellites, so one can then determine the three-dimensional coordinates of the receiver’s position.
A. Military units allow a position calculation within about 30 feet (10 meters).
B. Also used in earthquake prediction, ocean floor mapping, volcano monitoring, and mapping projects.
C. Because of accuracy of GPS units, latitude and longitude are increasingly being reported in decimal form.
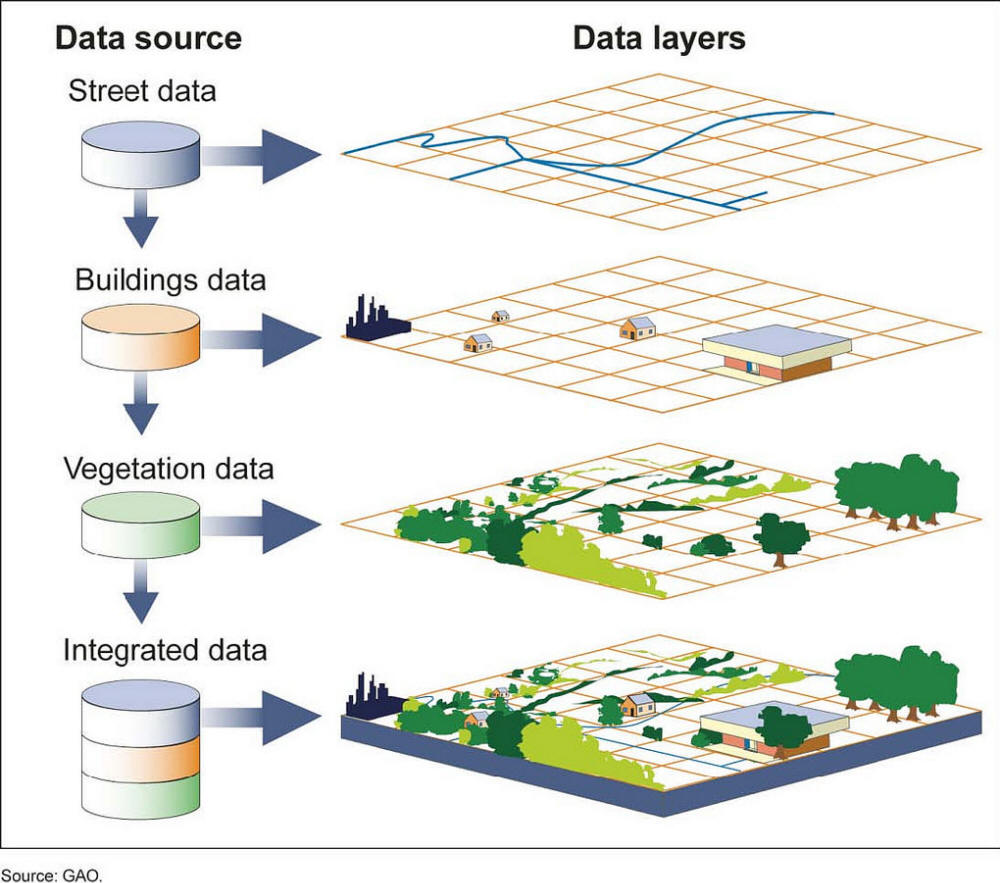
Geographic Information Systems
Geographic information systems (GIS)
are automated systems for the capture, storage, retrieval, analysis and
display of spatial data relative to positions
on Earth’s surface. GIS can show many different kinds of data on one
map. This enables people to more easily see, analyze
and understand patterns and relationships.
A. Uses both computer hardware and software to analyze geographic location and handle spatial data.
B. Virtually, libraries of information that use maps instead of alphabet to organize and store data.
1) Allows data management by linking tabular data and map.
2) Mainly used in overlay analysis, where two or more layers of data are superimposed or integrated.
3) First uses were in surveying, photogrammetry, computer cartography, spatial statistics, and remote sensing; now being used in all forms of geographic analysis, and bringing a new and more complete perspective to resource management, environmental monitoring, and environmental site assessment.
4) GIS was also used to compile structural data on the rubble at Ground Zero at the World Trade Center disaster. The technology allowed the building damage to be mapped and provided details on the outage of various utilities in the area.
Using GIS: Geodesigning Nature into Cities (PDF)
Models
Graphs and Statistics
The Scientific Method
Observe phenomena that stimulates a question or problem
Offer an educated guess (hypothesis) about the answer
Design an experiment to test the hypothesis
Predict the outcome of the experiment
Conduct the experiment and observe the outcome
Draw conclusions and formulate rules based on the experiment
Systems Theory
The Environmental Systems
The Solar System
rings of Saturn
 |
 |
 |
 |
 |
| |
|
A quintet of Saturn's
moons come together in the Cassini spacecraft's field of view. Janus
(111 miles across) is on the far left. Pandora (50 miles across)
orbits between the A ring and the thin F ring near the middle of the
image. Brightly reflective Enceladus (313 miles across) appears
above the center of the image. Saturn's second largest moon, Rhea
(949 miles across), is bisected by the right edge of the image. The
smaller moon Mimas (246 miles across) can be seen beyond Rhea also
on the right side of the image. |
A natural-color image of
Saturn from space, the first in which Saturn, its moons and rings,
and Earth, Venus and Mars, all are visible. |
The outer portion of the C
ring and inner portion of the B ring around Saturn. The images show
definite compositional variation within the rings. The B ring begins
a little more than halfway across the image. The general pattern is
from 'dirty' particles indicated by red to cleaner ice particles
shown in turquoise in the outer parts of the rings. The ring system
begins from the inside out with the D, C, B and A rings followed by
the F, G and E rings. |

The Planetary System

Earth’s Size and Shape

Seasons
Time
|