Macro Basics
Up


Print Friendly and PDF      Site Search and Site Map   


Table of Contents

PREVIOUS        NEXT

National-Income Accounting

Inflation

Unemployment


ECON MARGIN NOTES


National-Income Accounting


I. A measurement system used to estimate national income and its components

  1. Gross Domestic Product (GDP): The total market value of all final goods and services produced by factors of production located within a nation’s borders in a year. GDP is a flow, i.e., an activity that occurs over time. Contrast this with a stock measured at a point in time.

ReadGross Domestic Product (GDP): Measuring the Economy from the Federal Reserve Bank of San Francisco


DANCING STAR TO DENOTE GOOD SITEI strongly encourage you to take advantage of the Fed's 5-minute video learning guide on how to understand the Fed Data Post charts. The video is also available on the Fed's YouTube channel.


  1. Exclusions of Financial Transactions, Secondhand Goods, and Transfer Payments: Many transactions occur that have nothing to do with final goods and services produced.

  1. Financial Transactions: There are three categories of purely financial transactions.

  1. Securities: The value of brokers’ services is included in GDP when an investor buys or sells securities because they perform a service.

  2. Government Transfer Payments: Transfer payments are payments for which no productive services are concurrently provided in exchange.

  3. Private Transfer Payments: This is a private transfer of funds from one person to another and these are not included in GDP.

  1. Other Excluded Transactions

  1. Household Production: Tasks performed by homemakers within their households for which they are not paid through the marketplace.

  2. Otherwise Legal Underground Transactions: Legal transactions that are not reported and not taxed.

  3. Illegal Underground Activities: These activities include prostitution, illegal gambling, and sale of illegal drugs, etc.

  1. Recognizing GDP’s Limitations: GDP is a measure of production and an indicator of economic activity. It is not a measure of a nation’s welfare. It excludes non-market activity and says little about our environmental quality of life.

Measurements of the Macroeconomy

II. Two Main Methods of Measuring GDP: The expenditure approach is a way of adding up the dollar value at current market prices of all final goods and services. The income approach could also be used, by adding up the income received by everybody producing final goods and products.

  1. Deriving GDP by the Expenditure Approach: The components of total expenditures are added together.

  1. Consumption Expenditures (C): Consumption expenditures fall into three categories; durable consumer goods, non-durable goods, and services.

  2. Gross Private Domestic Investment (I): When economists refer to investment, they are referring to expenditures that represent an addition to our future productive capacity. Investment consists of fixed investment, changes in inventories, and consumer expenditures on new residential structures.

  3. Fixed Versus Inventory Investment: Fixed investment is the purchase of capital goods which increase productive capacity in the future. Inventory investment represents net additions to the stock of goods that can be consumed in the future.

  4. Government Expenditures (G): The government buys goods and services from private firms and pays wages and salaries to government employees. Since many government goods are not sold in the market place, we value them at their cost.

  5. Net Exports (Foreign Expenditures): Net exports (X) are equal to total exports minus total imports.

  1. Deriving GDP by the Income Approach: The second approach to calculating GDP is the income approach, which looks at total factor payments. Total income is all income earned by the owners (or resources) who put their factors of production to work. Using this approach gross domestic income or GDI is computed and GDI is identically equal to GDP.

  1. Wages: Wages, salaries, and other forms of labor income, such as income in kind and incentive payments. Social Security taxes paid by both the employees and employers are also counted.

  2. Interest: Only interest received by households plus net interest paid to us by foreigners is included.

  3. Rent: Income earned by individuals for the use of their real (non-monetary) assets, such as farms and houses.

  4. Profits: Total corporate profits plus proprietors’ income, i.e. income earned from the operation of unincorporated businesses, which include sole proprietorships, partnerships, and producers’ cooperatives.

  5. Indirect Business Taxes: All business taxes except the tax on corporate profits. Indirect business taxes include sales and business property taxes.

  6. Depreciation and Net Domestic Product: Depreciation must be added to Net Domestic Income to get Gross Domestic Income. Depreciation can be thought of as the portion of the current year’s GDP that is used to replace physical capital consumed in the process of production. Since somebody has paid for the replacement, depreciation must be added as a component of gross domestic income. Net Domestic Product (NDP) is GDP minus depreciation.

  1. Other Components of National Income Accounting

  1. National Income (NI): National Income is the total of all factor payments to resource owners and is obtained by subtracting indirect business taxes from NDP.

  2. Personal Income (PI): Personal Income (PI) is the amount of income that households actually receive before they pay personal income taxes.Disposable income was rising - until it wasn't.

  3. Disposable Personal Income (DPI): DPI is personal income after personal income taxes have been paid.


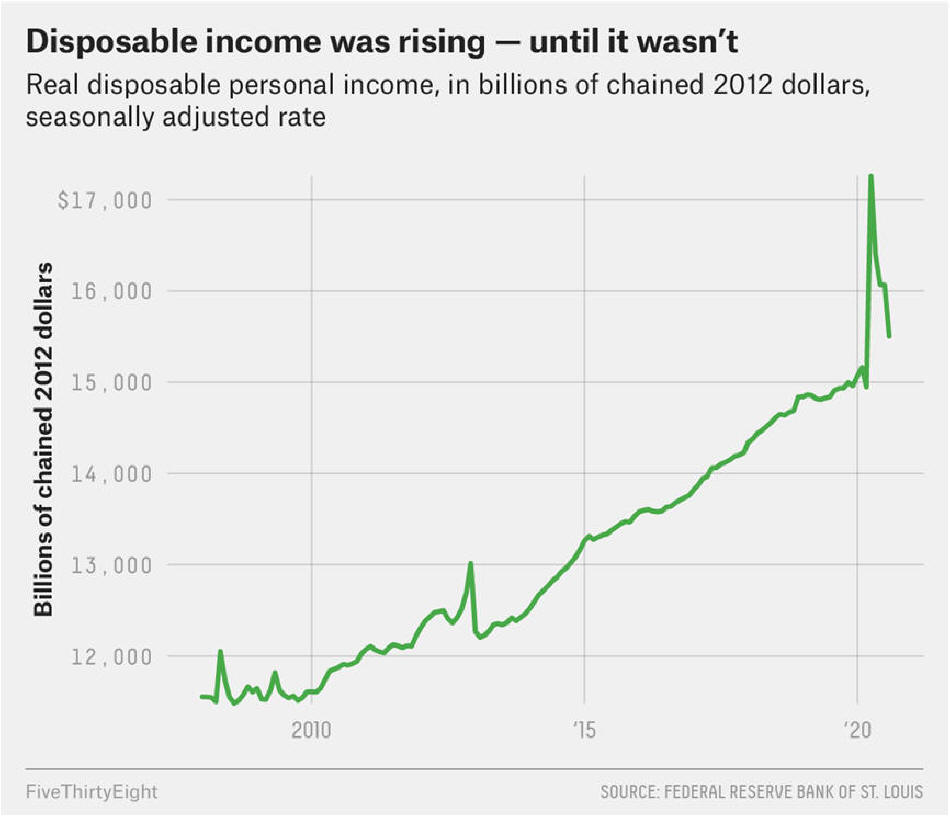
III. Distinguishing Between Real and Nominal Values: Nominal values are the values of variables such as GDP and investment expressed in current dollars (actual market prices), also called money values. Real values measure economic values after adjustments have been made for changes in the average of prices between years.

  1. Correcting GDP for Price Changes: A price index that approximates the changes in overall prices is divided into the value of GDP in current dollars to adjust the value of GDP to what is called constant dollars. Constant dollars are dollars expressed in terms of purchasing power using a base year or standard of comparison. Price-corrected GDP is called real GDP.

  2. Per Capita GDP: This is the calculation of the amount of GDP per person. Compute real GDP and divide by the total population.SHOPPING BASKET


IV. Comparing GDP Throughout the World: It is easy to compare living standards of families living in the same country because they use the same currency. When we compare families in different countries, there is a problem with different currencies and cost of living differences.

  1. Foreign Exchange Rates: A foreign exchange rate is the price of one currency in terms of another. Thus if one franc costs 20 cents and French per capita income is 100,000 francs per year, then French per capita dollar income is $20,000 per year. GDP can be calculated the same way.

  2. True Purchasing Power: Using purchasing power parity, an adjustment is made in exchange rate conversions that takes into account the true cost of living across countries.

Purchasing Power of the US Dollar, 1913-2013ReadSix Key Economic Variables (PDF)

A Beginner's Guide to Economic Indicators

Economic Indicators from the US Department of Commerce

Dig Deeper

Consumer Price Index

What is the single most important economic indicator for policymakers?

How Much Is That Worth Today? (scroll down)

Measuring Worth

Test Yourself


Test Yourself: National-Income Accounting

RETURN TO TOP


ECON MARGIN NOTES


InflationA VISUAL GUIDE TO INFLATION


DAVIES 07/01/2008

calculating the inflation rate

I. Inflation: The situation in which the average of all prices of goods and services in an economy is rising. Deflation is a situation in which the average of all prices in an economy is falling.


II. Inflation and the Purchasing Power of Money: The value of a person’s money income in buying goods and services is its purchasing power or the real value of the money. The price of anything expressed in today’s dollars. The purchasing power of money varies inversely with the price level.


III. Measuring the Rate of Inflation: Inflation is measured by a price index.

  1. Computing a Price Index: A fixed quantity price index is the cost of today’s market basket of goods expressed as a percentage of the cost of the same market basket in a base year. It is computed by dividing the cost of today’s market basket by the cost of that same market basket in the base year times 100.

  2. Real World Price Indexes

  1. The CPI: weighted average of a specified set of goods and services purchased by consumers in urban areas

  2. PPI: statistical measure of a weighted average of prices of the goods and services that firms produce and sell

  3. GDP Deflator: a price index measuring the changes in prices of all new final goods and services produced in the economy

ReadInflation: Measuring Price Changes, Federal Reserve San Francisco


IV. Causes of Inflation: quantity (form of demand-pull), cost-push, demand-pull, built in

  1. The Quantity Theory

    1. The quantity theory of inflation states that too much money in the economy leads to inflation.

    2. Adherents to this theory maintain that inflation can be tamed by increasing the money supply at the same rate that the economy is growing.

  2. The Cost-Push Theory

    1. According to the cost-push theory, inflation occurs when producers raise prices in order to meet increased costs.

    2. Cost-push inflation can lead to a wage-price spiral — the process by which rising wages cause higher prices, and higher prices cause higher wages.

  3. The Demand-Pull Theory

    1. The demand-pull theory states that inflation occurs when demand for goods and services exceeds existing supplies.

  4. See also the infographic to the right.


V. Effects of Inflation: High inflation is a major economic problem, especially when inflation rates change greatly from year to year.

  1. Purchasing Power: In an inflationary economy, a dollar loses value.  It will not buy the same amount of goods that it did in years past.

  2. Interest Rates: When a bank's interest rate matches the inflation rate, savers break even.  When a bank's interest rate is lower than the inflation rate, savers lose money. 

  3. Income: If wage increases match the inflation rate, a worker's real income stays the same.  If income is fixed income, or income that does not increase even when prices go up, the economic effects of inflation can be harmful.


VI. Anticipated Versus Unanticipated Inflation: Unanticipated inflation is inflation that comes as a surprise. Anticipated inflation is the inflation rate that we believe will occur and can be either higher or lower than the actual rate.


VII. Inflation and Interest Rates: The nominal interest rate is the market rate of interest. The real rate of interest is the nominal rate minus the anticipated rate of inflation. Evidence shows that inflation rates and nominal interest rates move together.

INFLATION WORD CLOUD

VIII. Does Inflation Necessarily Hurt Everyone?

  1. Unanticipated Positive Inflation: Creditors Lose and Debtors Gain: Creditors lose because the debtor is charged an interest rate that does not cover the actual inflation rate. If unanticipated inflation is greater than actual inflation, creditors gain and debtors lose.

  2. Protecting Against Inflation: Banks and other lenders raise interest rates to protect themselves from anticipated inflation. Workers seek cost-of-living adjustments, i.e., automatic increases in wage rates to offset inflation.

  3. The Resource Cost of Inflation: Businesses and individuals use resources to protect themselves from inflation, e.g. re-pricing goods and service. The resources could have been used to produce additional goods and services.

IX. Changing Inflation and Unemployment: Business Fluctuations: These are the ups (expansions) and downs (contractions) in business activity throughout the economy. A recession is a contraction or downturn in the level of business activity.

  1. Explaining the Business Fluctuations: External Shocks: While many downturns in economic activity have been caused by external shocks to the economy, e.g. war, changes in oil prices, and weather, many others have occurred without any external shock.


US BUSINESS ACTIVITY SINCE 1914


Dig Deeper


What if tech's next big thing is unstoppable deflation?

Inflation 101

The Supply Chain and Inflation

What if We’re Thinking About Inflation All Wrong?

Want to understand 2024? Look at 1948. Americans were angry with Truman because of high prices in the aftermath of WWII, even as other economic signals looked promising.

What Biden could do to bring grocery prices down

Shrinkflation is the term used to describe getting less for the same price. Companies downsize products without downsizing prices for a simple reason: Consumers often pay more attention to prices than sizes. Sellers have been shrinking products to avoid raising prices for centuries, and experts think it has been an obvious corporate strategy since at least 1988, when Chock Full o’Nuts cut its one-pound coffee canister to 13 ounces and its competitors followed suit. Shrinking is captured in official inflation data, but another sneaky force that costs consumers is getting missed in the statistics. Companies sometimes use cheaper materials to save on costs in a practice called skimpflation, and it is much harder for the government to measure. If your paper towel roll costs the same but you’re getting fewer sheets - shrinkflation - that shows up clearly as a unit cost increase that is added to official inflation. If your paper towels are the same size but are suddenly made of worse material - skimpflation - the government does not record that as inflation.

The Upside of Recessions

Test Yourself


Test Yourself: Inflation

RETURN TO TOP


ECON MARGIN NOTES


UnemploymentDAVIES 06/08/2008


I. Unemployment: the number of adults (16 years or older) who are willing and able to work and who are actively looking for work but have not found a job.


II. Historical Unemployment Rates: The proportion of the labor force that is unemployed. The labor force is the number of persons 16 years of age or older who have jobs plus the number who are looking and available for jobs. 


III. Employment, Unemployment and the Labor Force: All persons 16 years of age and over can be classified as not in the labor force (i.e. homemakers, and those in school), employed, or unemployed. Then the employed are subtracted from the labor force to get the unemployed. The unemployment rate is the number of unemployed divided by the labor force times 100.

  1. Categories of Those Without Work

  1. Job Loser: involuntarily terminated or laid off (40–60% of unemployed)

  2. Reentrant: worked full-time before but who left the labor force (20–30% of unemployed)

  3. Job Leaver: voluntarily ended employment (10–15% of unemployed)

  4. New Entrant: has never worked at a full-time job for more than two weeks or more (10–13% of unemployed)

  1. Duration of Unemployment: The duration of unemployment is inversely related to the overall level of economic activity. The average duration of unemployment is 3.4 months.

  2. The Discouraged Worker Phenomenon: Individuals who have stopped looking for jobs because they do not believe that they can find one are called discouraged workers.

  3. Labor Force Participation: This is the proportion of working age persons who are in the labor force. The statistic can be computed for any group.


IV. The Major Types of Unemployment:

  1. Frictional Unemployment: Unemployment due to the fact that workers must search for appropriate job offer. This takes time, so they remain temporarily unemployed.

  2. Structural Unemployment: Unemployment resulting from a poor match of workers’ skills and abilities with current requirements of employers. It also includes persons who are unemployed because of labor-market policies by government that make it expensive to employ workers (e.g. social insurance programs) and to fire them or lay them off by closing plants.

  3. Cyclical Unemployment: Unemployment resulting from recessions.

  4. Seasonal Unemployment: Unemployment resulting from the seasonal pattern of work in specific industries due to weather or demand patterns. The official reported unemployment rate reported each month is seasonally adjusted and thus reflects only the sum of frictional, structural, and cyclical unemployment.


V. Full Employment: Economists use the concept of the natural unemployment rate which is an unemployment rate that uses only frictional and structural unemployment as a measure of full employment. It is estimated to be an unemployment rate of around 5% in current economies.

ReadLabor Force Participation Rate from the Federal Reserve Bank of San Francisco

Unemployment Rate: Measuring the Workforce from the Federal Reserve Bank of San Francisco

An Unbalanced Age: Effects of Youth Unemployment on an Aging Society

Dig Deeper


When 25 million people leave their jobs, it’s about more than just burnout.

Test Yourself


Test Yourself: Unemployment

RETURN TO TOP


FOOTER LOGO

Copyright © 1996 Amy S Glenn
Last updated:   04/06/2024 0630

Creative Commons License